
- SBC Atlas |
- SB Atlas Tutorial
SB Atlas Tutorial
This section is a step-by-step guide on how to use many of the basic features of the Santa Barbara County Conservation Blueprint Atlas. The Conservation Biology Institute, creator of Data Basin, also offers tutorial videos and webinars on how to navigate the site, which can be viewed at https://sbcblueprint.databasin.org/videos.
The Home Page of the Santa Barbara County Conservation Blueprint Atlas is the introduction to the website. It describes ways for users to start using the website, and contains selectable icons for the themes of the Blueprint and major watersheds within the county, two ways of interacting and finding data and maps on resources within the region. The Explore by Theme icons are on the left side of the Home Page, and the Explore by Watershed boundaries are on the right page of the Home Page.

The Menu Bar gives users access to the functions of the Atlas. It consists of the About tab, Explore tab, Create tab, Collaborate tab, and My Workspace tab.

The About tab provides background information about the Atlas and Data Basin and offers support services and tutorials on how to use the site. The categories within the tab are:

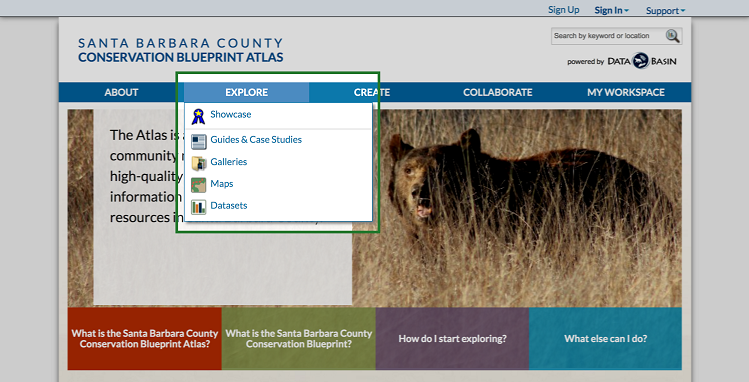
The Explore tab allows users to search through the information sources on the Atlas. The categories within this tab are:
The Create tab gives users the ability to create items. The categories within this tab are:
The My Workspace tab takes users to their membership home page, which is an interface for accessing and managing content, viewing messages, and seeing recently viewed content. See the discussion further below on My Workspace.


Many of the Atlas functions, such as viewing datasets and maps, do not require a Data Basin membership. However, signing up for a membership gives users access to the full functionality of the site. For example, signing up for a Data Basin membership will allow users to:

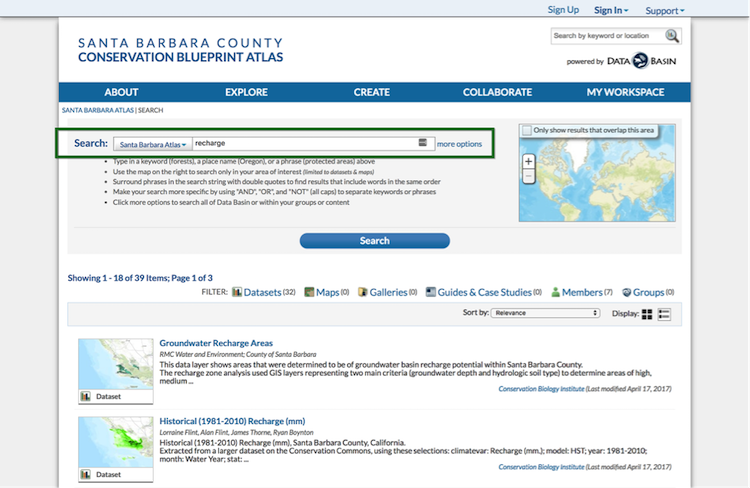
The search field at the top of the Home Page allows users to search for datasets by keyword or location. For example, if “recharge” is typed into the search field, all relevant information related to groundwater recharge will be identified, including datasets, maps, galleries, guides and case studies, members, and groups. Users can filter the results by clicking on Datasets under the filter option.


Before uploading a dataset, users must contact Data Basin Administrators to request permission. They can be contacted by using the contact us link at the bottom of the page or by e-mail at databasin@consbio.org.

Once permission has been granted, click Import a Dataset under the Create tab of the homepage.
Galleries are used to organize a set of similar datasets and maps. For example, the galleries for the Atlas contain maps and datasets organized by themes addressed in the project (water resources, flora and fauna, agricultural and ranch lands, and community and the land).
Viewing the Atlas Galleries
There are two ways to access the galleries from the Atlas homepage. The first way is by clicking on a theme icon on the left side of the homepage and then clicking on the gallery in the Explore related items tab on the right side of the theme webpage.

To do a more specified search of all the galleries, use the search field in the middle of the Galleries main page. For example, if users search for“agriculture” using the search field, it will identify several galleries that contain datasets and maps related to agriculture.
The Atlas includes numerous maps created by the admin account as part of the Santa Barbara County Conservation Blueprint that show the interconnectedness of natural resource challenges. Users can link to these maps by clicking on Maps under the Explore tab on the menu bar. Recommended maps are highlighted at the top of the page, and recent maps are shown underneath. Click on see more at the bottom right side of the page to see all the maps.

Users can create their own maps using data from the Atlas.
Click the Create tab and select Create a Map. This will bring users to a topography basemap.

To add a dataset to a map, click on the Datasets tab and select add datasets.

The drawing tool allows users to accentuate important aspects of their maps. Users can create shapes (polygons, rectangles, circles), draw lines and points, highlight features, and place text.
To create a drawing, click on the Create a Drawing tab under the Layers tab at the upper left hand side of the page.

To export a map, hover the mouse over the Export button at the top left corner of the map toolbar. Make sure the areas to be included in the exported map are within the gray box.
Click the Export button. Users can export a map as a PDF, PowerPoint presentation, or set of PNG picture files.

There are various ways to search for content in the Atlas. Users can search using a keyword, geography, or a combination of the two for a more targeted search.
The primary search field is located at the top right of every page. To start a new search, type a keyword into the search field and click the magnifying glass to the right. For better results, users can try running separate searches using the singular and plural forms of your keyword. If a phrase is being searched, it should be surrounded by quotes.
Using the checkboxes, users can show filtered results of combinations of datasets, maps, galleries, guides and case studies, members, and groups. For information about the different types of items, refer to the glossary found under the Get Started tab.

Groups are created by members to facilitate collaboration on specific topics, geographic areas, or projects. They make it easier to share user data, spatial information, and supporting information. For example, a group like the Cachuma Resource Conservation District could use the Groups function to coordinate planning efforts, such as a regional conservation plan among private landowners or among one individual land owner, where there are multiple staff members or stakeholders involved.
To create a group, click on Create a Group under the Create tab on the Menu Bar on the Atlas Home Page.


Once the profile has been created, there are four main areas on the workspace: Home, Content, Members, and Public Profile.
The Home tab can be customized to describe the group’s purpose. The page can be edited by clicking the manage button on the right-hand side of the page.


My Workspace is a user’s personalized and private space to manage their content and groups, to view messages.

Original text pulled from: San Joaquin Valley Phase II Summary Report. March 2017. Accessed May 2017: https://databasin2-filestore.s3.amazonaws.com/%40page_images/phase2_summary.pdf.
Home Page
The Home Page of the Santa Barbara County Conservation Blueprint Atlas is the introduction to the website. It describes ways for users to start using the website, and contains selectable icons for the themes of the Blueprint and major watersheds within the county, two ways of interacting and finding data and maps on resources within the region. The Explore by Theme icons are on the left side of the Home Page, and the Explore by Watershed boundaries are on the right page of the Home Page.
The Menu Bar
The Menu Bar gives users access to the functions of the Atlas. It consists of the About tab, Explore tab, Create tab, Collaborate tab, and My Workspace tab.
About
The About tab provides background information about the Atlas and Data Basin and offers support services and tutorials on how to use the site. The categories within the tab are:
- About Data Basin
- Take a Tour
- View Videos and Webinars
- Browse the Showcase
- Search Geographies or Keywords
- Explore a Sample Map
- Help
- Support Services
- Glossary
Explore
The Explore tab allows users to search through the information sources on the Atlas. The categories within this tab are:
- Guides and Case Studies
- Galleries
- Maps
- Datasets
Guides and Case StudiesThe Guides and Case Studies tab links to the theme pages and watershed pages as well as other projects and studies that showcase the use of data to demonstrate and analyze broad environmental and resource challenges.GalleriesThe Galleries tab links to all the galleries, which are collections of datasets and maps organized by theme.MapsThe Maps tab links the user to all the publicly available maps that have been created within the Atlas. See the discussion on Maps further down for more information on how to view and create maps.DatasetsThe Datasets tab provides a direct link to all datasets for the Atlas.
Create
The Create tab gives users the ability to create items. The categories within this tab are:
- Create a Map
- Import a Dataset
- Create a Group
- Create a Gallery
My Workspace
The My Workspace tab takes users to their membership home page, which is an interface for accessing and managing content, viewing messages, and seeing recently viewed content. See the discussion further below on My Workspace.
Membership
Many of the Atlas functions, such as viewing datasets and maps, do not require a Data Basin membership. However, signing up for a membership gives users access to the full functionality of the site. For example, signing up for a Data Basin membership will allow users to:
- Download maps and datasets
- Upload maps and datasets
- Save maps on the Atlas
- Create and join groups
- Create galleries
Users can either sign up directly on Data Basin or use
information from an existing Facebook account, Google account, Yahoo account,
or USGS staff account.
Datasets
Finding the Datasets
There are several options for linking to datasets.
Explore
Users can locate a dataset using the Explore tab. Click on
Datasets or Galleries under the Explore tab on the Atlas homepage.
By clicking on Datasets, the user can view all the datasets available on the Atlas. The page will initially only show “Recent Datasets.” Click on “see more” at the bottom right side of the page to show all datasets.
Users can use the sort menu to organize the datasets by creation date, modification date, or alphabetically. Users can also type a keyword in the filter bar at the left side of the page to narrow down the list of datasets by topic.
Alternatively, users can click on Galleries under the Explore tab to view the datasets organized by gallery. See the discussion on Galleries below to learn more.
Search Field
The search field at the top of the Home Page allows users to search for datasets by keyword or location. For example, if “recharge” is typed into the search field, all relevant information related to groundwater recharge will be identified, including datasets, maps, galleries, guides and case studies, members, and groups. Users can filter the results by clicking on Datasets under the filter option.
Viewing a Dataset
After navigating to the datasets using one of the methods
described above, click on the desired dataset. On the dataset overview page,
click on Open in Map at the upper right hand side of the page or click on the
image of your dataset. This will open the dataset in the map viewer.
Importing a Dataset
Before uploading a dataset, users must contact Data Basin Administrators to request permission. They can be contacted by using the contact us link at the bottom of the page or by e-mail at databasin@consbio.org.
Once permission has been granted, click Import a Dataset under the Create tab of the homepage.
To begin importing a dataset, upload the file and read the Data
Basin Terms of Use. Click submit.
Sufficient metadata is for users to determine the credibility of the data and decide if the data is relevant to their project. If valid metadata is found, it will be used to help populate these steps. If uploading files with similar metadata, click import information from one of your existing datasets. Users must change the metadata as appropriate for each specific dataset.
If there is an XML metadata file with the data set, the user can click import information from an XML metadata file to populate the fields.
Give the dataset a title.
Decide whether the dataset should be public or private. Public datasets are visible to all users of Data Basin and private datasets are only visible to the user and those who are granted access.
Choose whether to enable downloads of the dataset.
Continue to fill out the required fields.
The layers tab alerts the user to any areas that have been left blank.
Under attribute details, the user must provide a description. Attributes tend to be cryptic. This description allows for more clarity.
Click the submit button once finished.
To edit and manage your dataset, select the Manage button, for options to edit the dataset, manage permissions, or delete the dataset. The user can also open the dataset in a new map.
Galleries
Galleries are used to organize a set of similar datasets and maps. For example, the galleries for the Atlas contain maps and datasets organized by themes addressed in the project (water resources, flora and fauna, agricultural and ranch lands, and community and the land).
Viewing the Atlas Galleries
There are two ways to access the galleries from the Atlas homepage. The first way is by clicking on a theme icon on the left side of the homepage and then clicking on the gallery in the Explore related items tab on the right side of the theme webpage.
The second way is to click on
Galleries under the Explore tab on the menu bar, and then click see more
at the bottom right corner of the Galleries main page.
To do a more specified search of all the galleries, use the search field in the middle of the Galleries main page. For example, if users search for“agriculture” using the search field, it will identify several galleries that contain datasets and maps related to agriculture.
Maps
Viewing Existing Maps
The Atlas includes numerous maps created by the admin account as part of the Santa Barbara County Conservation Blueprint that show the interconnectedness of natural resource challenges. Users can link to these maps by clicking on Maps under the Explore tab on the menu bar. Recommended maps are highlighted at the top of the page, and recent maps are shown underneath. Click on see more at the bottom right side of the page to see all the maps.
Creating a Map
Users can create their own maps using data from the Atlas.
Click the Create tab and select Create a Map. This will bring users to a topography basemap.
The top of the map displays the toolbar. Within the toolbar,
users can:
Save the map for later use or to share with others.
- Export the map as a PDF, PowerPoint, or set of PNG
files.
- The Earth tool allows users to view the full extent of
the datasets. If no datasets are included, a map of the world will appear.
- The Locate tool enables users to pinpoint a location on
the map by looking at location name or latitude and longitude. When users
search a location name, it will add a point to the map to identify that
location.
- The Identify tool allows users to click on the map and
display an information window for all layers at that location. Users must have
at least one dataset in the map to use this feature.
- The Select tool allows users to select features
(points, lines, or polygons) from the top visible layer in an area that you
draw. Users must have at least one dataset in a map to use this feature.
- The Legend shows all styles used by visible layers in the map.
Adding a Dataset to a
Map
To add a dataset to a map, click on the Datasets tab and select add datasets.
To find datasets, users can do a keyword search; browse
recommended or popular items including datasets, maps, or galleries; and choose
from recently viewed items, or items that the user created.
Once the desired items are selected, scroll to the bottom of the page and click Add items. The datasets will appear on the map.
Using the arrow button within the Layers tab at the upper left hand side of your screen, users can access Dataset Details, Zoom, and Customize the Transparency.
Turn layers on and off by checking the boxes.
If users would like to change the layer order, click and drag the layer to the desired position within the table.
Creating a Drawing
The drawing tool allows users to accentuate important aspects of their maps. Users can create shapes (polygons, rectangles, circles), draw lines and points, highlight features, and place text.
To create a drawing, click on the Create a Drawing tab under the Layers tab at the upper left hand side of the page.
Give the drawing a title, then choose the drawing type, color,
border color, border style, and transparency.
Create the drawing and click submit.
After users are satisfied with their map, they can save it by clicking the Save icon. Users need to be signed in to save maps.
Save the map as either public or private, give it a title, credits, a description, and tag it with key search terms.
Exporting a Map
Create the drawing and click submit.
After users are satisfied with their map, they can save it by clicking the Save icon. Users need to be signed in to save maps.
Save the map as either public or private, give it a title, credits, a description, and tag it with key search terms.
Exporting a Map
To export a map, hover the mouse over the Export button at the top left corner of the map toolbar. Make sure the areas to be included in the exported map are within the gray box.
Click the Export button. Users can export a map as a PDF, PowerPoint presentation, or set of PNG picture files.
Searching
There are various ways to search for content in the Atlas. Users can search using a keyword, geography, or a combination of the two for a more targeted search.
The primary search field is located at the top right of every page. To start a new search, type a keyword into the search field and click the magnifying glass to the right. For better results, users can try running separate searches using the singular and plural forms of your keyword. If a phrase is being searched, it should be surrounded by quotes.
Using the checkboxes, users can show filtered results of combinations of datasets, maps, galleries, guides and case studies, members, and groups. For information about the different types of items, refer to the glossary found under the Get Started tab.
Search results can be sorted by name, date, or relevance.
Users can also change the display of the results to show as a grid or in list view.
If users want to add more conditions to their search, they can click more options to the right of the search view. Here users can modify their search to be within content they’ve uploaded or created in the Atlas, shared items in their groups, all of the Atlas, or all of Data Basin.
Click Add search condition to make searches more specific.
Map Search
Users
can also search the Atlas using the map on the right of the page to define an
area of interest.
Click and hold the map to pan to a specific area. Zoom in and
out using the plus and minus buttons. When the area of interest is within the
frame, check the box and click search. Results for the search will appear below
the map. For example, if a user is interested in searching for Santa Maria
datasets, make sure that the area to be searched is within the frame, check the
box, and click search.
Depending on the scale of your map location, users may come up with more results than desired. One way to narrow results is to combine the map search with the keyword search.
Groups
Depending on the scale of your map location, users may come up with more results than desired. One way to narrow results is to combine the map search with the keyword search.
Groups
Groups are created by members to facilitate collaboration on specific topics, geographic areas, or projects. They make it easier to share user data, spatial information, and supporting information. For example, a group like the Cachuma Resource Conservation District could use the Groups function to coordinate planning efforts, such as a regional conservation plan among private landowners or among one individual land owner, where there are multiple staff members or stakeholders involved.
Creating Groups
To create a group, click on Create a Group under the Create tab on the Menu Bar on the Atlas Home Page.
Give the group a name.
Decide whether the group will be public or private. Group administrators can control privacy
settings. Public profiles can be searched and reviewed by everyone. Users can
request to join and be approved by group administrators. Private groups are
only accessible to members of that group and members must be added manually by
administrators. If a group is private, a lock icon will appear once the group
is created.
Describe the group.
Tag it based on its type or subject. Examples of tags include location of the group and topics the group is focusing on.
Upload a photo for the user profile. If the user doesn’t have a profile, a generic image will be generated.
Lastly, create a workspace welcome message to provide information about common group tasks.
Click submit once the profile is finished.
Group Workspace Areas
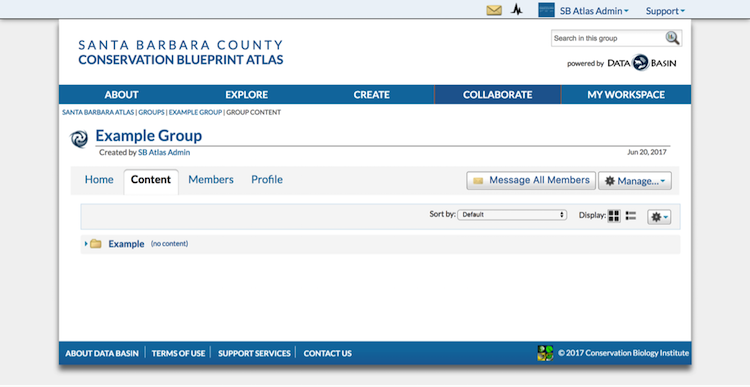
Once the profile has been created, there are four main areas on the workspace: Home, Content, Members, and Public Profile.
The Home tab can be customized to describe the group’s purpose. The page can be edited by clicking the manage button on the right-hand side of the page.
The Content tab is where group members can access datasets,
maps, and documents.
To add content, click on the gear icon on the far right of the
page and select Add Content. Search a topic, select the desired data, and click
add items. The data will appear on the group’s content page.
The dataset can also be added using the toolbar at the top of the page, which appears when the dataset is selected. Navigate to the toolbar and click Add to.
The dataset can also be added to a group while on the map page. Click on the dataset, open the map page, and select Add to.
The datasets in the group can be organized by creating folders. To do this, click Create Folder under the gear icon on the far right of the page.
Content can be added to these folders by using the toolbar at the top of the page that appears once a dataset is selected. Click Move Items in the dataset toolbar and choose the folder.
Within the toolbar, content can also be bookmarked, added to a group workspace, exported into PowerPoint, or removed from a group.
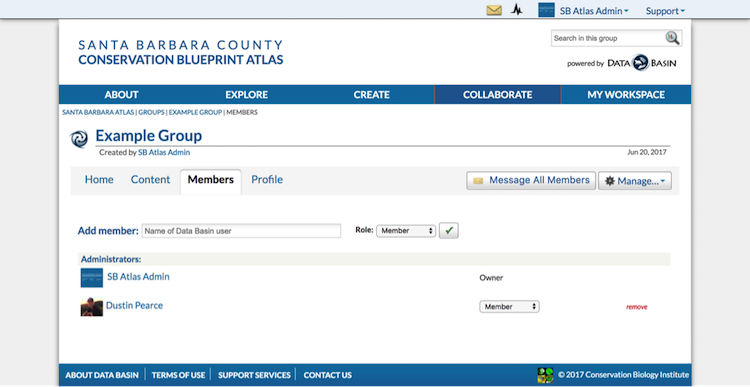
Members can be added in the Members tab of a user’s profile. Group administrators can add, remove, or change the status of any group member. When a member is added to the group, they have access to the group’s workspace and content. Type the name of the member to be added, define their role as member or administrator, and click the green check mark button. When a member is added to the group, they will receive
an email notifying them of their acceptance into the group.
The dataset can also be added using the toolbar at the top of the page, which appears when the dataset is selected. Navigate to the toolbar and click Add to.
The dataset can also be added to a group while on the map page. Click on the dataset, open the map page, and select Add to.
The datasets in the group can be organized by creating folders. To do this, click Create Folder under the gear icon on the far right of the page.
Content can be added to these folders by using the toolbar at the top of the page that appears once a dataset is selected. Click Move Items in the dataset toolbar and choose the folder.
Within the toolbar, content can also be bookmarked, added to a group workspace, exported into PowerPoint, or removed from a group.
Members can be added in the Members tab of a user’s profile. Group administrators can add, remove, or change the status of any group member. When a member is added to the group, they have access to the group’s workspace and content. Type the name of the member to be added, define their role as member or administrator, and click the green check mark button. When a member is added to the group, they will receive
an email notifying them of their acceptance into the group.
To message a member, click on the message button on their page.
Members will receive a message within their account as well as within their
email.
The Profile tab displays what people will see when they search for the group. Private profiles are only available to invited members of the group.
The Profile tab displays what people will see when they search for the group. Private profiles are only available to invited members of the group.
My Workspace
My Workspace is a user’s personalized and private space to manage their content and groups, to view messages.
To
access My Workspace, click on My Workspace Home under the My Workspace tab on
the Home Page.
Within the My Workspace home page, users can view recent
activity and access and manage their content. They can see the maps they have
created and their groups.
There are also buttons to Create a Map, Import a Dataset, or Create a Group.
The Workspace tab allows users to quickly access their work including their bookmarks, groups they belong to, guides and studies they have contributed to, maps they have created, and messages other members have sent to them.